Tuesday, May 2, 2017

UAS Data Collection

Introduction
Unmanned Aerial Systems are just what they sound like, a flight vehicle that does not have a human on it controlling it. They are controlled from the ground via a tablet or computer system. They can be programmed before take-off to perform a "mission" using ground control points (GCP's) or they can be manually controlled from the ground.

Study Area
The study area was the community garden at South Middle School in Eau Claire, WI (Fig. 1).
Figure 1. Southside Neighborhood Garden

Methods
A Dual Frequency Survey Grade GPS was used to gather soil data (Fig. 2). Three attributes were collected: pH, Temperature (in C), and Volumetric Water Content (%) using a TDR probe.
Figure 2. TheDual Frequeny Survey Grade
GPS used

On a later date, 15 GCP's were collected with the Dual Frequency Survey Grade GPS which would later enable the imagery to be synced to GPS data to turn it into a true map. Aerial imagery was collected using an Unmanned Aerial System called the DJ1 Phantom (Fig. 3). Weather is a very important factor when flying a UAS, and the wind was a steady 9 mph and there was no rain so the flight could be made without much struggle.There was trouble getting the RTK on the drone to start up, but that was solved by inserting an SD card. The mission was then conducted smoothly.
Figure 3. The UAS Phantom
Data was processed in Pix4D by Professor Hupy and then brought into ArcMap to be analyzed and to design the maps.

Results
Below is the imagery of the community garden captured by the UAS (Fig. 4).
Figure 4. Imagery from Unmanned Aerial System
In order to create maps using the data collected from the Survey GPS, the data needed to be normalized. This would have been done but access was denied due to an error with the file (Fig. 5). Therefore, there are no maps including the survey data.
Figure 5. Error in excel.
Discussion
The Unmanned Aerial System flew successfully and collected clear imagery for use in map making and tying down to a spatial existence. The combination of the ground-based data and aerial-based data makes geographic surveying that much more accurate and realistic.

Tuesday, April 25, 2017

Arc Collector Part II: Building a Database, Domain, and Attributes

Introduction
The purpose of this lab was to propose a geospatial question and then use Arc Collector to build a database, domain, and attributes to solve the problem. The question addressed in this project was, "Where are the most hazardous areas to rollerblade on common pathways in Eau Claire?" Three different pathways were analyzed. Hazards included twigs, rocks, dirt and sand cover, cracks, and bumps. Twigs and rocks were combined into one attribute and cracks and bumps were joined as well. Proper project design is important because there must be a problem to be solved, objectives that will help appropriately solve that problem, and attributes/data collection methods that pertain to the problem. Poor design can result in inaccurate data and unclear results.

Study Area
The study area chosen for this project was all on the lower campus residency area of Eau Claire, WI. Two of the three pathways were along the river, and the third was on a pathway near Half Moon Lake and down Water Street. These pathways were chosen because they are well-known and common pathways for rollerbladers and bikers.

Methods
Common hazards for rollerbladers include anything obstructing the pathway. Twigs, rocks, sand/dirt, bumps, and cracks were there attributes collected. Twigs and rocks were counted and collected as integer fields, as well as bumps and cracks. Sand and dirt cover was collected as a percentage to be translated into light (0-5%), moderate (6-15%), and severe cover (>15%). A point feature layer was created in ArcMap desktop and brought into ArcGIS online so that data could be collected via Arc Collector, just as was done in the previous lab. (See Fig. 1 & 2 below)

Figure 1. Appearance of attribute collection in Arc Collector
Figure 2. The map after data collection was complete.
Results and Discussion
The resulting web map from ArcGIS online can be found here.
Figure 3. Map displaying recorded amounts of cracks and bumps obstructing rollerblading paths in Eau Claire, WI. Three sizes of symbols represent different ranges of cracks and bumps, with the largest symbol representing the most obstruction. Each pathway is labeled with a number (1-3) for referencing purposes.
Pathway number 2 had three areas with much obstruction from cracks and bumps, however pathways 1 and 2 also had a lot of bumps and cracks but they are more spread out. Overall, pathway number 1 seems to be the safest in terms of crack/bump obstruction (Fig. 3).

Figure 4. Map showing different levels of dirt cover on three different rollerblade pathways in Eau Claire, WI. Each pathway is labeled with a number (1-3) for referencing.
Pathway 3 had multiple severe areas of dirt cover which is very dangerous for rollerbladers because it is very slippery under the wheels. Pathways 1 and 2 had a few areas of moderate sand/dirt cover but nothing really as heavy as pathway 3. Taking dirt cover and bumps/cracks into account, pathway 1 still appears to be the safest (Fig 4).

Figure 5. Map representing the amount of twigs and rocks obstructing the pathways in Eau Claire, WI. Each pathway is labeled with a number (1-3) for referencing.
In Figure 5, each pathway contains a severe patch of twigs and rocks which is at least 10. Pathway 1 had a consistent amount of twigs along the whole trail due to most of it being within the forest. Pathway 3 had the least amount (except for the short bit on Chippewa street) because it was mostly on water street sidewalk where there are not many trees or rocks around. Pathway number 2 had a moderate amount on its northern portion, also due to surrounding density of trees. Taking bumps/cracks, dirt cover, and twigs/rocks all into account, pathway number 1 seems to be the best route for a relatively hazard-free rollerblade ride, mostly because its levels of obstruction are mostly low to moderate, with very few areas of severity.

Conclusions
Proper project design was very important in solving this geographical problem because useful data needs to be collected in order to come to any conclusions. Latent variables may be determined by using other attributes to understand them and their affect on the problem. If this project were to be redone, it would be a good idea to collect a few more attributes, such as road crossings, steep hills, and obstacles such as tables/chairs outside of restaurants and coffee shops (mostly pertaining to Water St.). These are all important hazards that were not realized until data was being collected out in the field. This idea could be expanded upon by including more potential rollerblading pathways around lower campus as well as on upper campus or the downtown area.

Sunday, April 9, 2017

Arc Collector Part One: Microclimate

Introduction
In this lab, Arc Collector was used to collect microclimate data on the UW-Eau Claire campus. Arc Collector has an app which allows one to enter attributes using the cell phone's GPS. This is very useful for collecting data quickly and efficiently out in the field, as well as allowing for multiple people to be inputing data at once.

Study Area
The chosen study area was UW-Eau Claire campus. The campus was split into seven zones, and groups of 2-3 students collected data from each zone. I was assigned to collect from Zone 2.
(Fig. 1 & 3). Data was collected around 16:00 on Wednesday, April 5th.
Figure 1. Map of 7 zones used to split up and collect microclimate data on UW-Eau Claire campus
Figure 3. A view of the zone map in
the ArcCollector app
Figure 2. The Kestrel 3000
weather meter

Methods
The attributes collected in the microclimate survey were temperature, dew point, wind chill, wind speed, and wind direction. A compass was used to measure cardinal wind direction, and all other attributes were collected using Kestrel 3000 weather meter (Fig. 2).

Figure 4. Data input function in
ArcCollector app
The zone map for the study area was provided by the UWEC Geography Department so data collection could begin as soon as the ArcCollector app was downloaded. To record a point, tap the plus symbol at the top, and then a screen pops up with a spot to record each attribute (Fig. 4). Once all groups collected at least 20 points in their zone, the maps were downloaded from ArcGIS online and opened in ArcMap desktop in order to create continuous surface maps. The interpolation method used in this lab was Natural Neighbors.

Results/Discussion
Figure 5. Map displaying the dew points at UW-Eau Claire campus. Measured in degrees Fahrenheit. 
 The dew points ranged from 30 to 58. The highest dew points were found in the parking lot behind the Davies center. The coolest places were in the corners and edges of campus.
Figure 6. Map showing the temperatures at UW-Eau Claire campus. Measured in degrees Fahrenheit.
 Temperatures ranged from 49 to 62 degrees. The warmest temperature areas were behind Phillips hall, right in front of Hubbard hall, and outside Towers hall. Coolest temperatures were recorded from north of the Chippewa river as well as Governor's parking lot.
Figure 7. Map showing the wind direction at UW-Eau Claire campus. Measured in degrees from North. 
 Wind direction ranged from 0.5 degrees to 340 degrees. Most of the wind directions were in the 120-150 range. The areas with higher wind directions were mostly found on lower campus and near the river.
Figure 8. Map of the wind chill variance at UW-Eau Claire campus. Measured in degrees Fahrenheit.
 Windchill measurements ranged from 45 to 62 degrees. Just outside of Haas was the coldest windchill, and Towers hall area had the highest windchill. As you can see, majority of campus had a windchill within the range of 50-53 degrees.
Figure 9. Map of wind speed at UW-Eau Claire campus. Measured in miles per hour.
Windspeed appeared to vary from 0 to 30 mph, however being in the range 15-30mph was rare. Wind speeds were greatest in the Oakridge parking lot on upper campus. Most of campus appears to have a windspeed of 0 to 4 mph. Upper campus also appears to have higher wind speeds than lower campus.

An anomaly that was noticed is the wind speeds in the range of 22-30 mph. On a day when the average wind speed was 1 mph, it does not make sense that there would be a microclimate wind speed that high. This could be due to human error or an error in the Kestrel device. Voids in the dataset include a time recording for each point (some were forgotten or not recorded correctly), and lack of elevation data. Elevation may have a significant impact on microclimate and it is important to take this into account when making inferences about the area.

Conclusions
 This lab demonstrated how to use ArcCollector to quickly enter data while out in the field and have it immediately be brought into a map. ArcCollector is very effective for surveying in groups and being able to gather a lot of data in a short amount of time. It allows for a wide range of functions and uses for the data and even automatically creates a web map (viewable here).

Tuesday, March 28, 2017

Distance Azimuth Survey

Introduction
Figure 1. Measuring diameter of a tree
using a standard tape measure
The purpose of this lab was to explore different ways of surveying for when certain technology, such as a GPS device, may fail or be unavailable. Three different sites were surveyed, each using a different method. Each method involved measuring the diameter of the trees with a measuring tape (Fig. 1) and the latitude and longitude were measured from each focal point for spatial reference (Fig. 2). One method used a TruPulse laser that calculated the distance in meters as well as the azimuth in decimal degrees (Fig. 3). A second method used a regular compass for the azimuth and measuring tape for distance (Fig. 4 & 5). The third method required a device called "Sonin Combo Pro" (or rangefinder) (Fig. ) which sent a signal from the device at the focal point to a person holding another device next to the tree in order to measure the distance, and a compass. This data was considered to be implicit, which means it is all relative or approximate. Explicit data is exactly tied down to a geographic point.

Figure 2. GPS used to find longitude and
latitude at each focal point.
Figure 3. TruPulse laser device used to measure
distance and azimuth in the field
Figure 4. Normal compass for finding azimuth.


Figure 5. Excitedly using a measuring tape to measure distance
Methods
Study Area
Figure 6. Study Area in Putnam Park.
The three sites from which data points were collected were all located within Putnam Park on the UW-Eau Claire campus in Eau Claire, Wisconsin. Each location had snow cover as well as a number of red/white oaks of diameters ranging from 18cm to 86cm. The three sites were chosen to be spread apart from each other, but other than that, there were no criteria for site selection. Each focal point was chosen to be in the center of the woods rather than on the edge near the street so that the lasers could accurately reach the trees being measured (Fig. 6).

Data collection
Points were handwritten as they were measured in the field and later entered into an Excel spreadsheet and normalized (Fig. 7). The latitude and longitude where measured at the focal point of each study sight using a GPS device. The distance (from focal point to tree) was measured in meters, azimuth was measured in decimal degrees, and diameter of each tree was measured in centimeters.
Figure 7. Sample of data in Excel spreadsheet after normalization

Map Creation
Figure 8. Results after using
"Bearing Distance to Line command"
Figure 9. Results after using "Feature
Vertices to Points command"
Before the data could be brought into ArcMap, it needed to be normalized. This was done by taking the latitude and longitude values and dividing the minutes by 60. The data table was then brought into ArcMap using a tool called "Bearing Distance to Line Command" which is found in the toolbox under Data Management and the Features. This created a series of lines outward from the focal point (Fig. 8). Next, a tool called "Feature Vertices to Points Command" was used to turn each of the trees into points on the map (Fig. 9). This tool is found under the same category as the first tool, and what it does is it creates a feature class points from vertices of the input features. After this, basic mapmaking techniques were used to create a study area map (Fig. 10) and individual maps of each study site (Fig. 11).

Figure 10. Final map of study area including all three sites with tree locations at appropriate azimuths and distances.

Figure 11. Individual study sites using three different survey methods. Site 1: TruPulse device. Site 2: Compass and measuring tape. Site 3: Sonin Combo Pro device.
Results/Conclusions
This lab provided three new techniques for surveying which do not rely on heavy technology. This is very useful for varying conditions as the outdoors can be very unpredictable in terms of weather. It is also helpful because sometimes time or money restrictions do not allow for expensive gear or repairing broken gear. It is very important to have a back-up plan when doing field surveying so that the job can still be done under any circumstances. Each of these methods seemed reliable enough, however the basic measuring of each element with an old school device such as compass and measuring tape always seems to be the most reliable technique because there is no allowance for technological glitch. It seems that drone surveying has replaced this type of surveying because it is just so much faster and easier and can include tons of data in just one field survey.


Tuesday, March 14, 2017

Processing UAS Imagery with Pix4D

Introduction
Overview of Pix4D software
The objective in this lab was to get acquainted with using Pix4D software package to process imagery. An Unmanned Aerial System (UAS) was used to collect the imagery provided for processing in Pix4D.

What is the overlap needed for Pix4D to process imagery? What if the user is flying over sand/snow, or uniform fields? For a general case, at least 75% frontal overlap (with respect to flight direction) and 60% side overlap (between flying tracks) is needed. If flying over sand/snow, or uniform fields then at least 85% frontal overlap and 70% side overlap are necessary.

What is Rapid Check? Rapid check is a function that speeds up processing by lowering the resolution of the original images. It is recommended for use in the field because it is much quicker than full processing.

Can Pix4D process multiple flights? What does the pilot need to maintain if so? Yes, the pilot needs to maintain 3 things: 1. each plan captures the images with enough overlap, 2. there is enough overlap between 2 image acquisition plans, and 3. the different plans are taken as much as possible under the same conditions (sun, weather, new construction, etc.)

Can Pix4D process oblique images? What type of data do you need if so? Yes, it can process oblique images as long as the user knows what angle off nadir the images were collected.

Are GCPs necessary for Pix4D? When are they highly recommended? GCP's are not necessary, but they provide information on scale, orientation, and absolute position, so they are highly recommended when working with images which don't have any geolocation.

What is the quality report? The quality report basically provides all of the metadata and allows the user to see if there are any errors to take note of before moving forward.

(Answers provided by Pix4D Software Manual)

Methods
Walkthrough of Pix4D software
Step 1: Open the Pix4D Mapper software and create a new project. When naming the project, it is important to include the date, site, platform or sensor, and altitude. The name for this project was 20160621_litchts_phantom3_60m ("ts" was added to identify the creator's initials).

Step 2: Select images to add. All of the imagery needed for this project was located inside a folder, so the "add directories" function was used to add all images at once. Pix4D will then read the metadata associated with the imagery and note if they are geotagged as well as indicating the coordinate system used. Camera properties are also included but are often unreliable and will need to be edited. Change the camera model to Linear Rolling Shutter. Parameters should then look like Fig. 1.
Figure 1. Camera parameters as viewed in Pix4D.

Step 3: Leave the coordinate system in default, it should be WGS84/UTM zone 15N. Next, choose the 3D maps processing template. Now the set-up is complete and processing can begin.


Figure 2. Prior to beginning steps 2 and 3 (Note: step 1 is
UNCHECKED!)
Step 4: Now a map of the flight path is showing. Uncheck steps 2 and 3 at the bottom and then open processing options. In the DSM and Orthomosaic tab, change the raster DSM method to Triangulation for the best results. Then you can run the Initial Processing. Once that is finished (it will be awhile), uncheck step one and re-check steps 2 and 3 and click start (Fig. 2).

Summary of quality report: 100% of the images were used (68 total), none were rejected. Georeferencing was used however there were no 3D GCP's. Most of the area had very good overlap (Fig. 3), the only areas with low overlap were the left and bottom edges. This may be due to lack of full coverage from some images but this is a very minor detail.
Figure 3. Shows overlap of imagery used in Pix4D. Green areas have high overlap which is good, yellow/red areas have poor overlap.

Results

Here is an animation fly-over created in Pix4D as well as a map of the Litchfield mine created in ArcMap using the raster datasets created in Pix4D.
Figure 4. Map of Litchfield Mine created in ArcMap.

Conclusion

Final Overview of Pix4D software
Pix4D software is very user friendly for those who have had an intermediate amount of GIS training. It makes turning imagery into a real map with metadata much easier than old school processes. Through this lab, a new understanding of aerial imagery was gained after seeing all of the metadata that goes into creating maps. Using Pix4D in this activity was solid preparation for future field surveying with drones and transforming imagery.

References
https://support.pix4d.com/hc/en-us/articles/204272989-Offline-Getting-Started-and-Manual-pdf-#gsc.tab=0
http://hagenfieldmethods.blogspot.com/2016/05/processing-uas-data-in-pix4d.html

Tuesday, March 7, 2017

Using Survey123

Introduction
The intention of this lab was to get acquainted with ESRI's "Survey123", an app for gathering survey-based field data. An online tutorial from the ESRI website uses data collection to help a homeowner's association develop tools to be more prepared for natural disasters and their repercussions. The objective is to build skills in these areas: creating a survey with Survey123, submitting a survey with a URL link in a web browser as well as in the Survery123 field app, analyzing survey results in the Survey123 website, and sharing survey results with other ArcGIS platform client apps. (Objectives directly from ESRI lesson site).
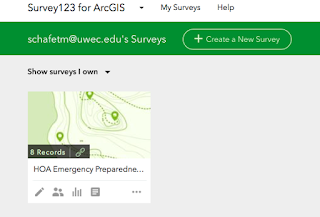
  Figure 1. My first survey on Survey123

Methods
Lesson One: Create a survey
First, I logged into the Survey123 website using my enterprise account through UWEC. Next I created new survey through the website server, and added a few simple questions to the survey like participant name, location with an interactive map, and date of survey submission. I learned how to add simple questions like fill in blank, single choice, and multiple choice and how to make them mandatory with a red asterisk. Next I learned how to set a dependency so that certain questions will appear based on answers to previous questions. For example, if one answers "yes" to a question, a certain question will pop up and if one answers "no" to the same question, the secondary question will not appear. Next I added 9 yes/no questions pertaining to the 9 "fix it" safety questions developed by an HOA (homeowner's association) for earthquake and fire preparedness and named it the HOA Emergency Preparedness Survey (Fig. 1).

Lesson Two: Complete and submit the survey
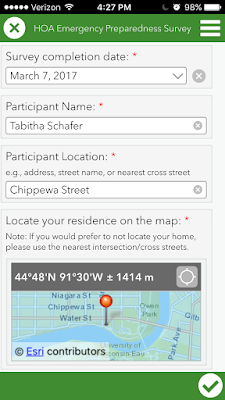
For part two, I viewed and took the survey from both a web browser and a smart phone via the Survey123 app (Fig. 1). I collected a sample of data by submitting the field survey a number of times with varying answers. I explored the app to take a look at all of the functions, such as the "submit later"  and "empty sent surveys" functions (Fig. 3).
Figure 2. Inside the HOA Emergency Preparedness
Survey on a smartphone
Figure 3. Submitted surveys in the Survey123 app.
Note the option to empty sent surveys.


Lesson Three: Analyze survey data
Figure 4. Survey data viewed as a heat map to show
where most of surveys were taken
To analyze the data, I viewed an overview page on the Survey123 website which showed: total number of surveys submitted, total number of participants (based on accounts), and the dates of first and last surveys submitted (Fig. 5). I learned that many results can be viewed as a bar graph, pie charts, percentages, or points on a map. Numeric questions provide statistics like min/max, average, and sum. I learned how to analyze individual survey responses and use filters to select what data I want to show/include during analyzation. Survey data can be exported as a .csv, shapefile, or file geodatabase, and can also be viewed in ArcGIS Map viewer to see where the most surveys are being taken (Fig. 4).

Lesson Four: Sharing survey data
Figure 5. A graph showing the dates of each survey taken
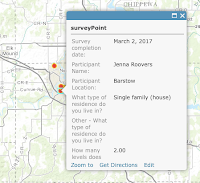
In part 4 I learned how to configure pop-ups on a web map to show information from each survey when you click on point on map (Fig. 6). I also learned how to save a web map with a description and tags so that others can find it. I then created a web app through which other HOA members can access my survey results (Fig. 7).
Figure 6. An example of a pop-up on the web map

Figure 7. The completed web app for the HOA Emergency
 Preparedness Survey Viewer


Results
Most of the surveys were taken on March 7th. 3 out of the 8 participants were located on Chippewa St. in Eau Claire WI, and only one of the 8 participants was located outside of Eau Claire. 62% of surveyors came from Single family homes while the other 38% came from multi-family residencies. Of those in single-family homes, the average number of levels was 2.6, and the average number of people (among all types of residency) was 4.75. Every household contained at least one person between the ages of 18 and 60 years old, while only 12% of homes contained a child of 0 to 5 years of age. Pads and velcro were found to be the most common modes of securing computers, while straps were most common for televisions. 75% of participants admitted to having objects on the walls above their beds. 75% of homes were found to have at least one fire extinguisher. The most common emergency object found in these 8 households was a first-aid kit.

Link to web app: https://uwec.maps.arcgis.com/home/item.html?id=e0f790f2fc38490fb550c9417943e5d0

Conclusions
Survey123 makes it very easy for anyone to turn qualitative data into quantitative data and then project it onto a map. It is so easy to use and understand and I plan on using it very much in further field studies because it keeps everything in one place and allows a very simple transformation of data. It also allows for the sharing of collected data via web map and web app, which is vital because why else would we do this research if not to share our findings? On top of that, the accessibility of the Survey123 app on not only any web browser, but also a smartphone or tablet, makes this app very appealing to someone with a lot of field research in their future.

Developing a Field Navigation Map

Objective
The goal for this lab was to create a cartographically pleasing navigation map to be used for a future project at the Priory, a parcel of land owned by UW-Eau Claire.

Introduction
Navigation maps require a different set of characteristics than a normal map. Since they are used for finding one's way around, a location system of some sort is necessary such as a coordinate system and a projection. A coordinate system assigns a system of numbers used to define locations in the field, and a projection takes longitude and latitude and converts them into an XY coordinate system. In this lab, the Universal Transverse Mercator (UTM) coordinate system was used for one map (Fig. 2), and a Geographic Coordinate System (GCS) was used for another map (Fig. 3) so that the two could be compared in terms of which one is most useful and easy to understand.

Methods
This lab involved two parts: finding a personal pace count and the creation of the navigation maps.
Part 1: Pace Counting
To determine a personal pace count, a distance of 100 meters was measured out and each person counted the steps they took with their right foot along this distance (Fig. 1). (My personal pace count is 63 steps per 100 meters). This was repeated twice for accuracy.
Figure 1. Study Area for pace counting.


Part 2: Developing the navigation maps
Two maps were created for part 2: one containing a UTM grid at 50 meter spacing, and the other providing Geographic Coordinates in Decimal Degrees. The data used to create these maps was provided by the UWEC Geography Dept. The first step was to import the basemap containing aerial imagery of the study area into ArcMap. The the study area was identified by a layer provided by the UWEC Geography Dept. showing the boundaries of the Priory. A contour layer showing elevation in 5 meter increments was added as well because elevation is important in navigation. The contour layer was clipped to show contour lines only inside the study area to make the map look more neat. The aerial basemap was reduced to a 30% transparency for cartographic reasons as well. Then, in order to make sure all of the layers were in the NAD_1983_UTM_Zone_15N coordinate system with the Transverse Mercator projection, each layer had to be reprojected using the project raster tool. To add the grid system to the map, a new grid was created in the data frame properties. For this UTM map the grid was a measured grid with 50 meter spacing (Fig. 2)

For the GCS map, the basemap imagery, elevation contours, and study area layers were all reprojected into the GCS_North_American_1983 coordinate system and the measured grid was removed and a graticule grid was added with decimal degrees showing 4 decimal places (Fig. 3).


Results
Figure 2. UTM navigation map of the Priory with a 50 meter interval grid and 5 meter elevation contours.
Figure 3. GCS map with decimal degrees and 5 meter elevation contours.
Conclusion
The UTM map is a little bit less cluttered because the intervals of the grid are larger, however this causes a lack of precision when navigating. Both maps are good for different purposes. The GCS map allows for closer navigation while the UTM map is better for approximation and less detailed surveying. The UTM map is also easier to understand for someone who does not have a lot of navigation experience because it is measured in meters, while decimal degrees may not mean a whole lot to someone who has never learned how to reference them.

Tuesday, February 21, 2017

Cartographic Fundamentals

In this lab, the fundamental requirements of mapmaking are explored and explained. There are a few essentials one must include in a map in order to make it decipherable. Elements such as the north arrow, scale bar, title, watermark, locator map, and legend are very important for understanding what the map is portraying, but metadata is also as important. Each of the following maps includes the necessary elements as well as the data and metadata explaining how the maps became what they are.

Part One: Creating a map
To create a map of the sandbox terrain, coordinate points were collected by creating a grid with string and tacks and then measuring elevation with a meter stick (see Sandbox Survey I and II for details). The map shown below (Fig. 1) features an aerial view of a hillshade display which adds shadows from taking into account the sun's relative position. It also features the terrain from four different oblique angles to show the geographical features at different viewpoints. The mean depth was -2.7 cm, and the minimum was - 13.5 cm, and the maximum was 4.9 cm.
Figure 1. The Sandbox Survey from 5 different views. Left: aerial view with hill shade effect. Scale bar represents length of sandbox, north arrow indicates true north. Depth is measured in centimeters, with negative values being below sea level and positive values above sea level. Top Right: oblique view from northwest corner. Second Down on Right: oblique view from northeast corner. Third down on Right: oblique view from southeast corner. Bottom Right: oblique view from southwest corner. 
The ridge can be found in the western area, it is the blue ovular shape. The hill is also blue and can be found in the northeast corner of the map. The depression is the round, yellow and orange and pink area near the hill in the northeast part of the map. The valley is the long yellow region in the southern portion of the map. The plain is the large pink area that stretches across the middle of the map.

Part Two: Creating a map using data with Attributes
To create maps using data with attributes, data provided by the UWEC Geography Dept was brought into ArcMap. The data used was collected from Hadleyville cemetery in Eleva, Wisconsin on September 14th, 2016 using a DJI Phantom quadcopter at 50 meters high. The data was used to create four maps, each of which displays a different attribute for the cemetery. Each map used the WGS 1984 projection.

A nominal map labeling the YOD for each grave
Figure 2. A map representing each grave at Hadleyville cemetery with the year of death labeled. Graves are represent by a grey triangle. Graves without a date next to them are unknown. A locator map indicates where the cemetery is found in Wisconsin. 
To create this map (Fig. 2), the labels were turned on and set to "YOD" so that the year of death would be shown next to each grave. The font color was set to white to make it easily seen. The north arrow was inserted, and a scale bar set to meters. A locator map of the state of Wisconsin was provided including Eau Claire County and a symbol where Hadleyville Cemetery is located within. The scale for the locator map was also set to meters to maintain homogeneity.

A nominal map providing the last name on the grave
Figure 3. A map showing the Hadleyville cemetery with last names labeled next to graves. Graves are represented by grey triangles. A locator map indicates where this cemetery is found in Wisconsin.
To create this map (Fig. 3), the "YOD" label setting was changed to "Last_Name". It shows the last name of the deceased next to each grave. Everything else on the map was kept constant with the first map (Fig. 2).

A nominal map that has color coding for if a grave is standing or not
Figure 4. A map showing whether each grave is standing, not standing, or unknown. A locator map indicates where this cemetery is found in Wisconsin.
To create this map (Fig. 4), the labels were removed and the symbology for the Graves feature class was changed to Unique Values based on the Standing attribute field. This provided a different color for each of 3 categories: standing, not standing, and unknown. The locator map, north arrow, and scale were all kept constant with previous maps (Fig. 2 and 3).

A numeric ranking map that has different sizes of points related to the YOD
Figure 5. A map representing each grave by year of death. Older graves have smaller symbols. A locator map indicates where this cemetery is found in Wisconsin.
This map (Fig. 5) was created by changing the symbology to Quantities > graduated symbols, so that symbols increased in size as the year of death got closer to the present time. They were split into 5 classes. Once again, the locator map, scale bars, and north arrow were all kept constant.

*Note: Statistical metadata is missing for these maps because they are not raster files

The goal of this lab was to incorporate all of the fundamental elements of a map and portray proper usage of those elements. They include the north arrow, legend, scale bar, title, locator map, and watermark. Without all of these elements, the document is not considered a map, so it is vital that these not be forgotten when creating a map.

Monday, February 13, 2017

Sandbox Survey II: Interpolating Data in ArcMap

Introduction 
In Sandbox Survey I, x, y, and z coordinates were collected from a man-made terrain in a sandbox plot (Fig. 1). The purpose was to utilize one of the sampling techniques for large areas to collect data. Data Normalization is adjusting values to a common scale so that they can be worked with. The data points collected from the sandbox survey needed to be normalized in order to show realistic differences in depth and to be interpolated into ArcGIS for further analysis. 
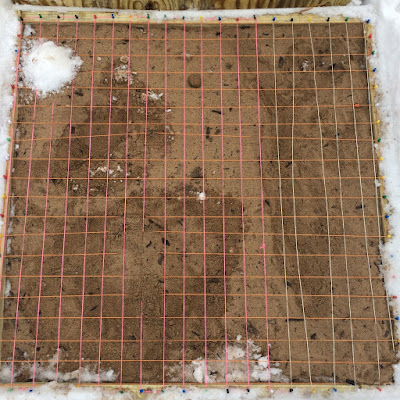
Figure 1. The sandbox plot with coordinate grid and man-made terrain. 
 
Interpolation is the method of estimating cell values in a raster by using limited sample data points. There were 213 data points provided, and once normalized, they provide information describing the depth of the terrain in each subset, and the interpolation procedure used helps to fill in the "holes" where data was not collected for the sample survey. 

Methods 
For organizational purposes, a new geodatabase was created as a place to keep all of the raster files interpolated into ArcMap. After the data containing the Z values was normalized in Excel, it was imported as an XY data table in ArcCatalog. It was then brought into ArcMap as a point feature class, exported as a layer file, and added to the geodatabase in order to be opened in ArcScene (Fig. 2). When data is brought into ArcMap like this, it is important to export it as a layer file so that it is permanent and can be worked with. The point feature class "brought the data to life" and was then ready to be turned into a continuous surface using the various interpolation techniques described below.
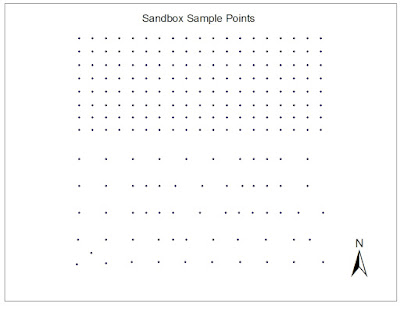
Figure 2. XYZ sample points represented as a points feature class in ArcMap
IDW: Inverse Distance Weighted interpolation determines cell values by assuming that points which are close to each other are more alike than they are with points further away from them. It gives greater weight to the sample points surrounding the cell and less weight to the sample points further from the cell.  The advantage of this method is that it is usually quite accurate. The disadvantage, however, is that it cannot generate estimated points higher than the highest sample point or lower than the lowest sample point, so random sampling makes it easy for this method to become inaccurate. (ArcGIS Help)

Natural Neighbors: this method applies weights to the nearest subset of sample points based on their proportionate areas. It is different from the IDW method because it only uses a subset of surrounding points, instead of using all of the sample points. A pro for this method is that it works well with both regularly distributed data as well as irregularly distributed data, but a con is that like the IDW method, it cannot generate estimated points beyond the range of the sampled points. (ArcGIS Help)

Kriging: creates a surface based on spatial arrangement of surrounding values or using mathematical formulas to determine statistical relationships between measured points. The mathematical formulas help to eliminate inaccuracies, however it is difficult to know which formula would work best for the data at hand without prior knowledge of complex math and statistics. (ArcGIS Help)

Spline: creates a smooth surface passing through all measured points using a mathematical function to estimate missing values. This method is able to observe trends and create highs and lows that may not have been actually sampled, but if values are close together but have drastically differing values, this method struggles. (ArcGIS Help)

TIN: this method uses a tool which turns raster points into a Triangular Irregular Network. The edges of these triangles capture the position of things like ridge lines or streams. TIN works best for data sets with a high sample size in areas with large variation in elevation. This method can estimate pretty much any unknown point, however it is known to be the least reliable of these 5 interpolation methods.

The 3D scene images of each interpolation method were exported as jpegs in order to be used in a map layout. This made the images easily transferrable into ArcMap to compare next to the 2D images. The orientation of the 2D images was decided to be the same orientation of the photo of the sandbox plot in Sandbox Survey I to prevent confusion (Fig. 1) The orientation of the 3D images was the same as that of the 2D images for proper comparison. A scale bar was used to ensure that each map is in the same scale and therefore can easily be compared with each other. Scale and orientation are important for interpreting such maps because the disproportion of the 3D maps may cause the 2D maps to appear larger or smaller than they truly are. 

Results & Discussion
The IDW interpolation method produced an average-looking representation of the sandbox terrain (Fig. 3). The surface appeared very bumpy, however it did represent each of the points that were sampled. Each of the man-made geographical features is visible in this map, however the ridge and the hill appear to have points when in reality they should be smooth. The flat plain is represented smoothly here.
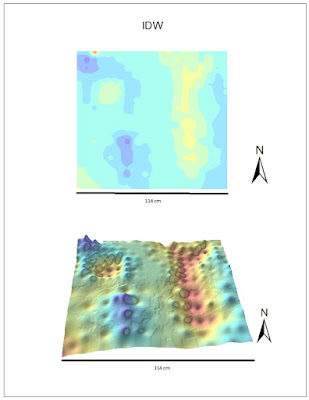
Figure 3. IDW interpolation method. Top map shows the 2D depiction of sandbox plot, bottom map shows 3D depiction. Scale bar on bottom represents length of plot.
The Natural Neighbors interpolation method still showed peaks in the ridge that should not be there, however the depression and the valley are both very well done (Fig. 4). There are also some bumps that should be smoothed out, but overall this method seems to be very good at distinguishing depth and filling in the spaces.
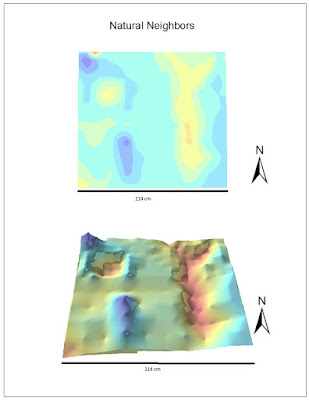
Figure 4. Natural Neighbors interpolation method. Top map shows the 2D depiction of sandbox plot, bottom map shows 3D depiction. Scale bar on bottom represents length of plot. 
The Kriging interpolation technique did not provide an attractive model( Fig. 5). The 2D model provided a good representation of depth using the symbology, however the 3D model did not represent depth well at all. It was very jagged looking and the geographical features hardly had a difference in depths at all.
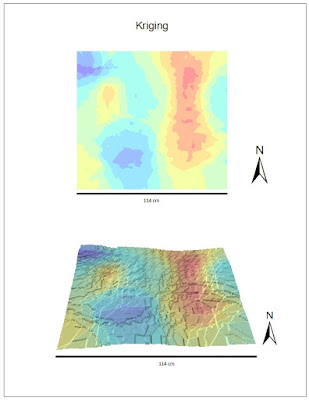
Figure 5. Kriging interpolation method. Top map shows the 2D depiction of sandbox plot, bottom map shows 3D depiction. Scale bar on bottom represents length of plot.
The Spline interpolation method was the best option for this data set. It created a very smooth surface and the hill, depression, ridge, plain, and valley were all distinguishable. The shadow effect helped to show edges that are not visible in the 2D image. Although it still does not look perfect, the spline interpolation method appears to best represent the data at hand.
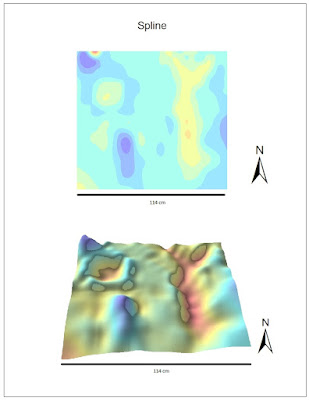
Figure 6. Spline interpolation method. Top map shows the 2D depiction of sandbox plot, bottom map shows 3D depiction. Scale bar on bottom represents length of plot.
 The TIN interpolation method successfully showed each of the geographical features, however there was no smoothness to the image (Fig. 7). This method does a very good job with depth and creating a general depiction of the landscape, but it is not a good representation of the true terrain.
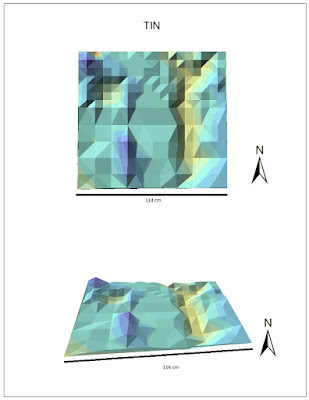
Figure 7. TIN interpolation method. Top map shows the 2D depiction of sandbox plot, bottom map shows 3D depiction. Scale bar on bottom represents length of plot.

Each of these interpolation methods provided a 3D image of the sandbox plot containing a ridge, valley, plain, depression, and hill. This shows that enough data points were sampled to ensure that each land feature was recognized and the "gaps" were able to be filled in. If this lab were to be repeated, it could be said that even less sample points might be taken because these interpolation tools do a very good job of estimating landscape and depth. The accuracy of these techniques, however, is dependent on the sample data and it is important to have a solid sampling strategy from the start.

Summary & Conclusions 
This survey is similar to other field based surveys because it requires strategic sampling of measured values from a large area. The concept is the same in that a limited amount of data is used to represent a larger area. However, it is different because in this field survey the values were measured by human instead of a computer or device of some sort, so there is much room for human error. It is not always realistic to perform a detailed grid-based survey because there are limitations on time, money, equipment, weather, and workers. All of these factors play a heavy role in determining the type of field survey to be used. Interpolation methods can be used for continuous data or things that are generally spatially-based. This includes things like temperature, rainfall, chemical composition, noise level, and others. 

Resources
ArcHelp desktop
Previous GIS student blogs (Paul Cooper and Rachel Hopps)
Esri Help

http://planet.botany.uwc.ac.za/nisl/GIS/spatial/chap_1_11.htm